Customer Behavior Analytics for SMEs: How Data Turns Insight Into Growth
Why Customer Behavior Analytics for SMEs is a Competitive Advantage
In today’s fast-paced market, understanding customer behavior is no longer optional—it’s a strategic advantage. Yet many small and mid-sized businesses (SMEs) are flying blind, relying on gut feeling rather than data. That’s where customer behavior analytics for SMEs comes in—it bridges the gap between gut feeling and insight.
This guide is crafted specifically for decision-makers—CEOs, COOs, VPs, and Directors—who want to:
- Know their customers deeply
- Make better decisions, faster
- Grow smarter with limited resources
Step 1: Set Clear Business Objectives Before You Dive into Data
Before launching a customer analytics initiative, align on the why.
Example Objectives:
- Reduce churn by 15% in 6 months
- Increase upsell opportunities to existing clients
- Improve marketing ROI by targeting high-value behaviors
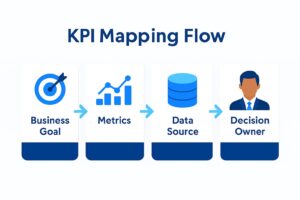
Step 2: Map Data to Power Customer Behavior Analytics for SMEs
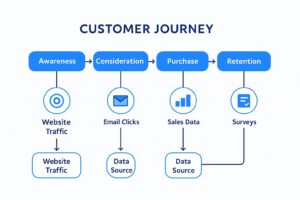
Understanding behavior means connecting data from every touchpoint.
Map Data Across:
- Acquisition: Ad clicks, lead forms
- Engagement: Website pages viewed, product usage
- Conversion: Purchase, subscription
- Support: Ticket volume, NPS, churn reasons
Data Sources:
- CRM (e.g., HubSpot, Salesforce)
- Web Analytics (Google Analytics, Hotjar)
- Social Media (Meta, LinkedIn)
- Email Tools (Mailchimp, MailerLite)
- Support Tools (Zendesk, Intercom)
Learn more from Salesforce’s overview of customer journey analytics and how it empowers better decisions.
💡 Tip: When launching your first customer analytics dashboard, start with a limited data set (e.g., top 20 customers). Validate findings before expanding. This phased approach ensures quick wins and builds stakeholder confidence.
Step 3: Identify Behavioral KPIs That Predict Growth
Raw data is noise. What you need are decision-ready insights. These KPIs form the foundation of customer behavior analytics for SMEs focused on retention and loyalty
Example KPIs:
| Objective | KPI | Benchmark | Owner |
| Reduce churn | Engagement Frequency | ≥ 3 sessions/week | Customer Success |
| Increase repeat buys | Time Between Purchases | < 30 days | Sales Ops |
| Improve CX | NPS Score vs Touchpoints | > 8.5 | Support Lead |
📁 Downloadable Template: KPI Tracker & Mapping Spreadsheet (CTA here)
Step 4: Analyze the Patterns That Matter
You don’t need to be a data scientist. You need to ask better questions:
- Why do high-value clients return?
- What do churned customers have in common?
- Where are users dropping off in the buying process?
Tools to Use:
- Power BI (for dynamic dashboards)
- Excel PivotTables (for segmentation)
- Google Looker Studio (for marketing insights)
Forrester’s guide to data literacy
Step 5: Act on Insights – Not Gut Feel
This is where most SMEs stall: they find the insights, but don’t act.
Action Examples:
- Personalized onboarding emails for low-engaged customers
- Automate win-back campaigns for lapsed buyers
- Adjust pricing for high-churn segments
Real-World Story: How a Boutique Retailer Increased Retention 28%
Context: A small beauty brand had a loyal base but was losing customers at the 6-month mark.
Problem:
- No system to flag disengaged customers
- Marketing team overwhelmed with general campaigns
Solution:
- Used customer analytics to segment by engagement frequency
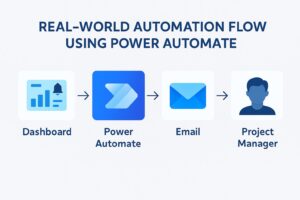
- Set up Power BI dashboard to alert team weekly
- Triggered personalized re-engagement emails via Mailchimp
Outcome:
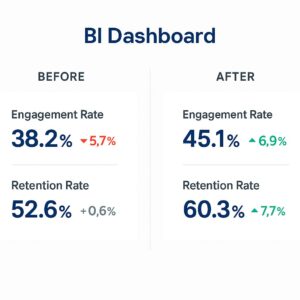
✅ 28% increase in 12-month retention
✅ 2x email campaign response rate
✅ $35K in forecasted LTV gains over 12 months
Common Pitfalls to Avoid
Even with tools like Power BI, many SMEs get stuck in these traps:
- Trying to track everything (instead of focusing on key KPIs)
- Skipping the action step
- Not aligning analytics with business goals
- Failing to involve the right stakeholders early
🔍 Tip: Have weekly “Insight-to-Action” standups where teams review trends and make micro-adjustments
Final Takeaways: What You Can Implement This Week
- Start with 3 core objectives tied to customer success
- Map out your customer journey touchpoints and data
- Define 3–5 behavioral KPIs that predict loyalty or revenue
- Build a simple dashboard in Power BI or Excel to track them
- Automate one action based on your insights
🧠 Don’t try to boil the ocean. Start small, iterate, and refine.
Want Expert Help?
🎁 Click here to get our Free Customer Behavior KPI Tracker + Guide
👉🏽 Learn how our Power BI Dashboard Audit can uncover hidden gaps.
