
Introduction: Why Power BI Matters for Finance Leaders
Power BI consulting for finance is the fastest way for COOs and CFOs to turn fragmented data into decisions that cut costs, reduce risk, and keep teams accountable. Spreadsheets and static reports can’t keep up with today’s pace. Power BI gives you executive-grade visibility—live KPIs, drill-through detail, and governed access—so you can steer the operation with confidence.
Under the hood, Power BI connects to your core systems (GL, loan systems, CRM, core banking, ERP), models the data, and presents it in clean, role-based dashboards. With the right implementation, finance leaders see exactly what’s driving cost, risk, and customer experience—and what to fix next. Microsoft’s own guidance shows proven patterns for adoption, governance, and security at enterprise scale. Microsoft Learn
What Financial Leaders Need Right Now (and Why BI Projects Fail)
Most financial institutions already have BI tools, yet adoption and ROI lag. Common failure patterns:
-
Too many reports, not enough answers. No single source of truth, so decisions stall.
-
Manual wrangling. Analysts spend more time reconciling than analyzing.
-
Security concerns. Sensitive data requires tight control by role and region.
-
No operational cadence. Dashboards exist, but they don’t drive weekly action.
Power BI solves these, but only when implemented with finance-first use cases, governance, and change management. Microsoft’s adoption guidance (usage tracking, governance, and an exec sponsor) correlates with real ROI. Microsoft Learn
The COO Playbook: 5 Power BI Use Cases That Move the Needle
1) Close the Books Faster (and With Fewer Surprises)
-
Consolidate GL, subledgers, budgeting, and headcount.
-
Automate variance analysis and drill-down to journal detail.
-
Create Month-End Command Center dashboards: status by entity, late tasks, data quality checks, SLA countdowns.
Microsoft’s finance report patterns (Financial Overview, KPIs, and trend analysis) are a proven starting point for FP&A and leadership dashboards. Microsoft Learn
Mini-story: A regional lender consolidated 14 disconnected reports into one executive view. Close reviews shifted from “chasing numbers” to “correcting drivers,” trimming 2 days from the close and catching a recurring expense misclassification worth six figures annually.
2) Cost Optimization by Branch, Product, and Process
-
Benchmark cost per branch, FTE, account, loan, and transaction.
-
Surface outliers: utilities, overtime, third-party fees, exception handling.
-
Tie costs to process steps (e.g., mortgage origination, dispute handling) to find bottlenecks.
McKinsey shows that simplifying core processes at scale reduces operating costs while improving customer satisfaction—mortgage originators with top-quartile process performance beat average cost by ~60%. McKinsey & Company
Our clients use Power BI consulting for finance to cut branch-level inefficiencies and drive measurable savings.
Quick win: A “Top Cost Drivers” view with slicers by region and product, plus weekly alert tiles for lines exceeding thresholds.
3) Risk & Compliance, in Real Time
-
Monitor Key Risk Indicators (KRIs): credit, liquidity, operational, regulatory findings.
-
Build Audit-Ready dashboards with lineage, data freshness, and owner details.
-
Enforce Row-Level Security (RLS) so each user only sees what they should—crucial for regulated data.
Microsoft’s RLS and security whitepaper provide battle-tested patterns that auditors love (roles, DLP, and access management). Microsoft Learn
Strong governance is at the heart of our Power BI consulting for finance engagements, ensuring compliance with every dashboard.
Pro tip: Pair RLS with deployment pipelines and change tracking. Your auditors will thank you.
4) Revenue & Deposit Analytics (Find Profitable Mix Faster)
-
Track pricing sensitivity, product profitability, and cross-sell lift.
-
Identify low-balance, high-cost segments and retention plays.
-
Combine marketing + product + service data to see what actually drives growth.
McKinsey notes that banks connecting tech investments to outcomes investors care about (digital sales %, tech debt, cost-to-serve) outperform peers—especially when metrics are transparent and tied to strategy. McKinsey & Company
5) Customer Experience & Churn Early-Warning
-
Fuse contact center, digital behavior, and NPS/CSAT into a Customer Health score.
-
Diagnose friction: login failures, drop-offs, or long resolution times.
-
Trigger save-actions: fee refunds, proactive outreach, or UX fixes.
Mini-story: One credit union tracked mobile app friction (failed transfers and slow check deposit). By fixing two UX issues, they saw a 23% lift in app satisfaction over six months and a measurable drop in churn tickets.
6) Executive “Run the Business” Dashboard (Bonus)
-
One screen for COO/CFO: Cost-to-Serve, Risk Radar, CX Health, and Workforce Capacity.
-
Drill-through to owner and action plan in 2 clicks.
-
Weekly cadence: review, decide, assign, and log outcomes directly from links on the dashboard.
Why it works: When leadership uses the same view every week, the organization aligns around a small set of KPIs that actually change behavior. HBR has long argued that data-driven culture is a leadership behavior as much as a technology investment. Harvard Business Review
Implementation Roadmap (8–12 Weeks)
Phase 0: Strategy & Guardrails (Week 1)
-
Align on business questions tied to cost, risk, growth.
-
Draft an initial data governance & security approach (owners, access, retention).
-
Identify 2–3 quick wins.
Phase 1: Data Foundations (Weeks 2–4)
-
Connect prioritized data sources; create a conformed semantic model.
-
Define KPIs (clear formulas, owners, refresh cadence).
-
Stand up RLS roles, workspace strategy, and deployment pipelines.
Phase 2: Dashboard Build (Weeks 4–6)
-
Build executive dashboards + drill-downs.
-
Add data quality tiles, SLA timers, and issue logs.
-
Measure adoption from day one (who uses what, and when). Microsoft Learn
Phase 3: Pilot & Iterate (Weeks 6–8)
-
Weekly working sessions with Finance Ops and Risk.
-
Validate calculations with controllers and auditors.
-
Harden governance (DLP policies, access reviews). Microsoft Learn
Phase 4: Scale & Enable (Weeks 8–12)
-
Document “How to read this dashboard” and embed short Loom videos.
-
Train analysts on DAX patterns, RLS, and performance tuning.
-
Roll out to additional segments (e.g., commercial lending, cards).
Must-Have Features for Finance Dashboards
1) Role-Based Views (RLS)
Executives see the whole, managers see their area, and branch leads see only their branch. This is table-stakes for regulated institutions. Microsoft Learn
2) Lineage, Owners, and SLAs
Show refresh time, data owners, and links to definitions. Build trust by making the “data contract” visible.
3) Issue Heatmap
Log exceptions (e.g., reconciliation breaks, audit points), owner, ETA, and status. Trend them weekly.
4) Glossary & Definitions
Link definitions directly in the report: “What is cost-to-serve?” “How is NPS calculated?”
5) Alerts & Subscriptions
Push the right updates to the right people. Executives shouldn’t hunt for key changes.
6) Performance Tuning & Model Health
Follow Microsoft’s optimization guidance for faster visuals and stable models as usage grows. Microsoft Learn
Build vs. Buy: When Templates Help
You can accelerate with vetted content packs for finance (e.g., Financial Overview in Business Central or AppSource accelerator packs). These provide a baseline model and visuals you can tailor to your chart of accounts and KPIs. Microsoft Learn
Caveat: Don’t let templates dictate your business logic. Start from your KPIs, not the other way around.
Security, Compliance, and Audit Readiness (Without Friction)
-
Row-Level Security keeps sensitive records scoped by role, geography, or legal entity.
-
Workspaces & Pipelines separate dev/test/prod and simplify change control.
-
DLP Policies (Microsoft Purview) reduce leakage of sensitive data and map to regulations (GDPR, CCPA).
-
Access Reviews ensure least privilege over time.
Microsoft’s Power BI security whitepaper is the definitive reference for architecture and controls. Share it with Audit and InfoSec to speed approvals. Microsoft Learn
Adoption: Make Dashboards Change Behavior
Technology without behavior change fails. Borrow these practices:
-
Weekly Ops Ritual. 30-minute “run the business” using one dashboard. Decisions recorded in the tool you already use (Jira, Planner, Monday).
-
Owner-Per-Metric. Every KPI shows an owner, target, and next action.
-
Measure Usage. Who opens what, how often, from where. Use adoption tracking to remove unused reports and improve the ones that matter. Microsoft Learn
-
Teach the Why. Short videos inside the report explaining each visual and decision rule.
HBR research underscores it: data-driven culture is a management system (metrics + rituals + incentives), not a software purchase. Harvard Business Review
ROI: What Good Looks Like in 90 Days
-
Close faster: 1–3 days reclaimed by eliminating manual reconciliations.
-
Ops cost down: 10–20% savings from process simplification and cost-to-serve visibility. McKinsey & Company
-
Audit-ready: Time-to-evidence cut from weeks to hours.
-
Churn down: CX health scorecards surface early-warning signals for proactive saves.
-
Adoption up: 70%+ of targeted managers use the dashboard weekly (measured).
Why Nexus Data Works
You’re not buying dashboards—you’re buying decisions made faster. Our Power BI consulting for finance approach is built for COO/CFO outcomes:
-
Executive Alignment Workshop. We translate strategy into 6–8 operational KPIs.
-
Data & Security Blueprint. Semantic model, RLS, lineage, and governance.
-
Pilot in Weeks. We deliver a working executive view in 6–8 weeks, then scale.
-
Enablement. We train your analysts and build on your team’s strengths.
Deliverables: KPI model, dashboards, RLS roles, governance guide, adoption tracking, and a 90-day ROI plan tied to cost, risk, and CX.
Getting Started
-
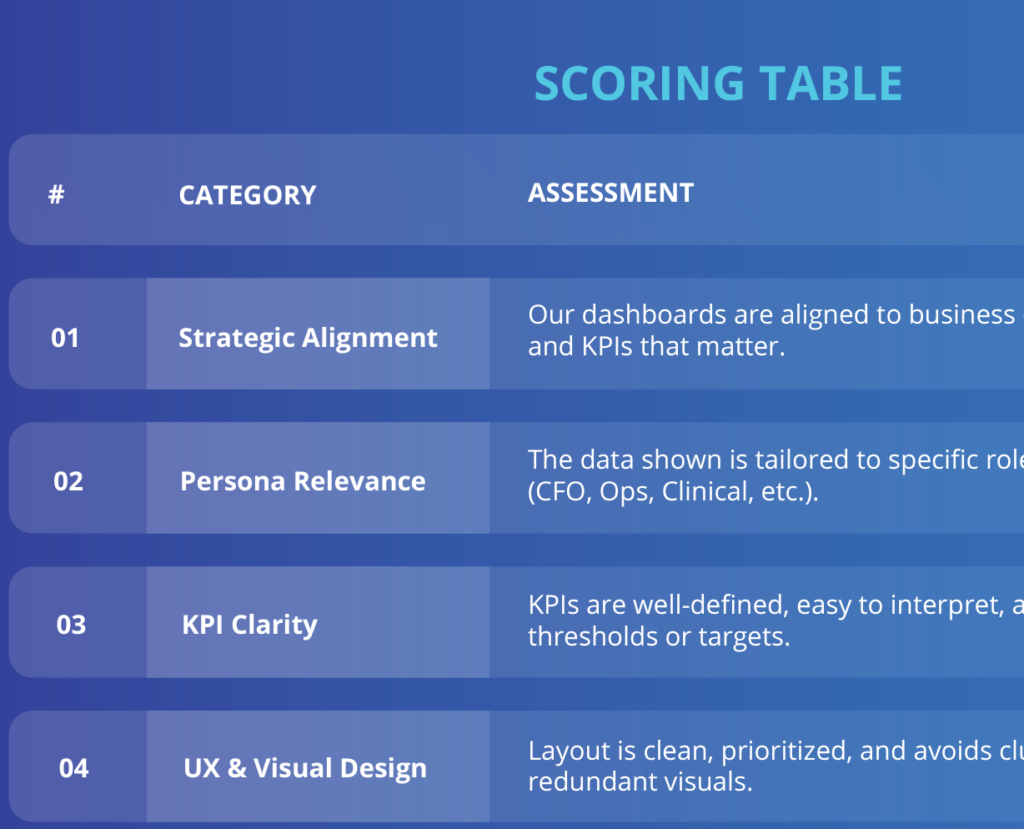
Scorecard: Request our Power BI Finance Scorecard (readiness, gaps, ROI).
-
Pilot: Pick 2 high-impact use cases (e.g., cost-to-serve + risk radar).
-
Scale: Expand to revenue analytics and CX once governance is in place.
👉 Ready to move beyond reports to real-time action? Book your consultation
FAQs
What is Power BI consulting for finance?
Power BI consulting for finance helps financial institutions implement dashboards that track KPIs, automate reporting, and enhance decision-making.
Can Power BI reduce operational costs in finance?
Yes. By tracking inefficiencies across branches, staffing, and utilities, Power BI dashboards identify waste and opportunities for cost savings.
Is Power BI secure enough for sensitive financial data?
Absolutely. With row-level security, Azure integration, and audit-ready dashboards, Power BI is designed for regulated industries like finance.
How long does it take to implement Power BI consulting?
Most institutions see results in 6–12 weeks, depending on system complexity and data integration requirements.